No products in the cart.
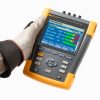
The ideal portable motor analysis test tool, the 438-II can help locate, predict, prevent, and troubleshoot power quality problems in three-phase and single-phase power distribution systems, while giving technicians the mechanical and electrical information they need to effectively evaluate motor performance.
- Measure key parameters on direct-on-line motors including torque, RPM, mechanical power and motor efficiency.
- Perform dynamic motor analysis by plotting of motor de-rating factor against load according to NEMA guidelines.
- Calculate mechanical power and efficiency without the need of mechanical sensors, just connect to the input conductors and youre ready to go.
- Measure electrical power parameters such as voltage, current, power, apparent power, power factor, harmonic distortion and unbalance to identify characteristics that impact motor efficiency
- Identify power quality issues such as dips, swells, transients, harmonics and unbalance.
- PowerWave data technology captures fast RMS data, and shows half-cycle averages and waveforms to characterize electrical system dynamics (generator start-ups, UPS switching etc.).
- Waveform capture function captures 100/120 cycles (50/60 Hz) of each event detected event, in all modes, without set-up.
- Automatic transient mode captures waveform data at 200 kS/s on all phases simultaneously up to 6 kV.
>
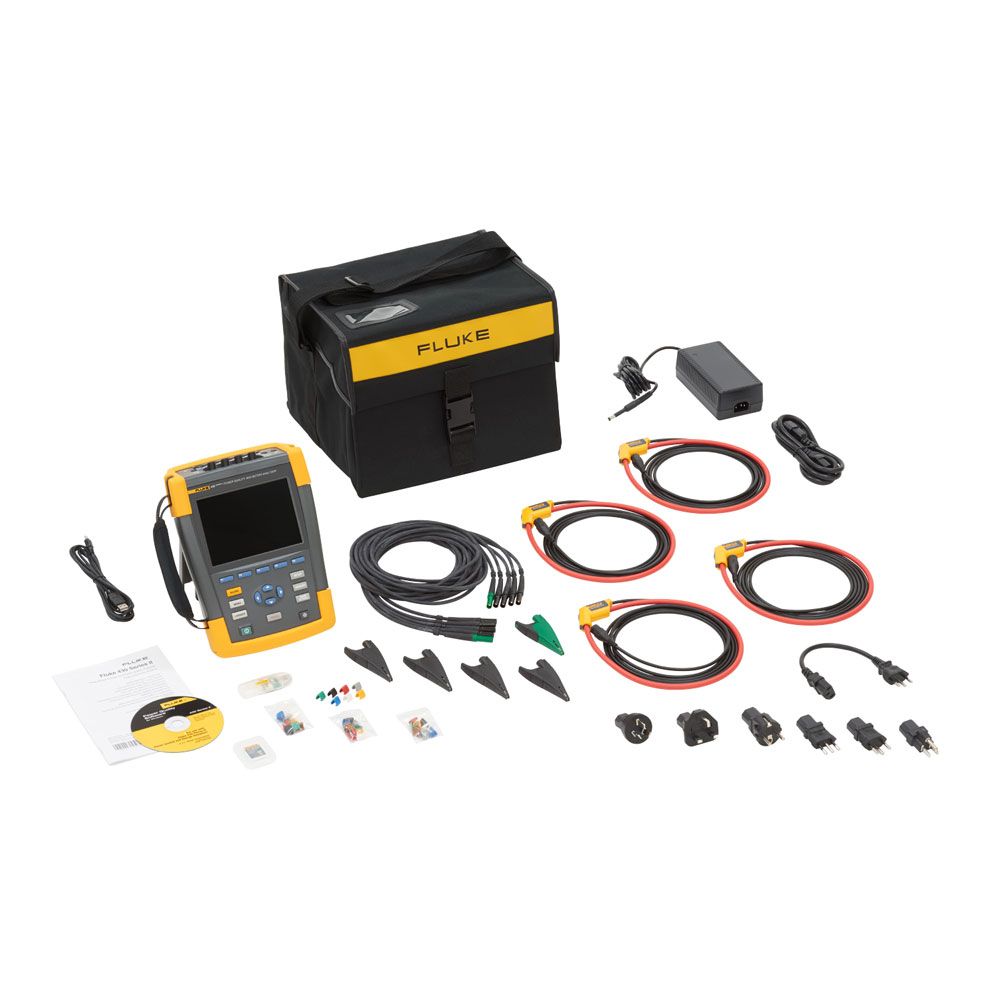
Each Unit Includes
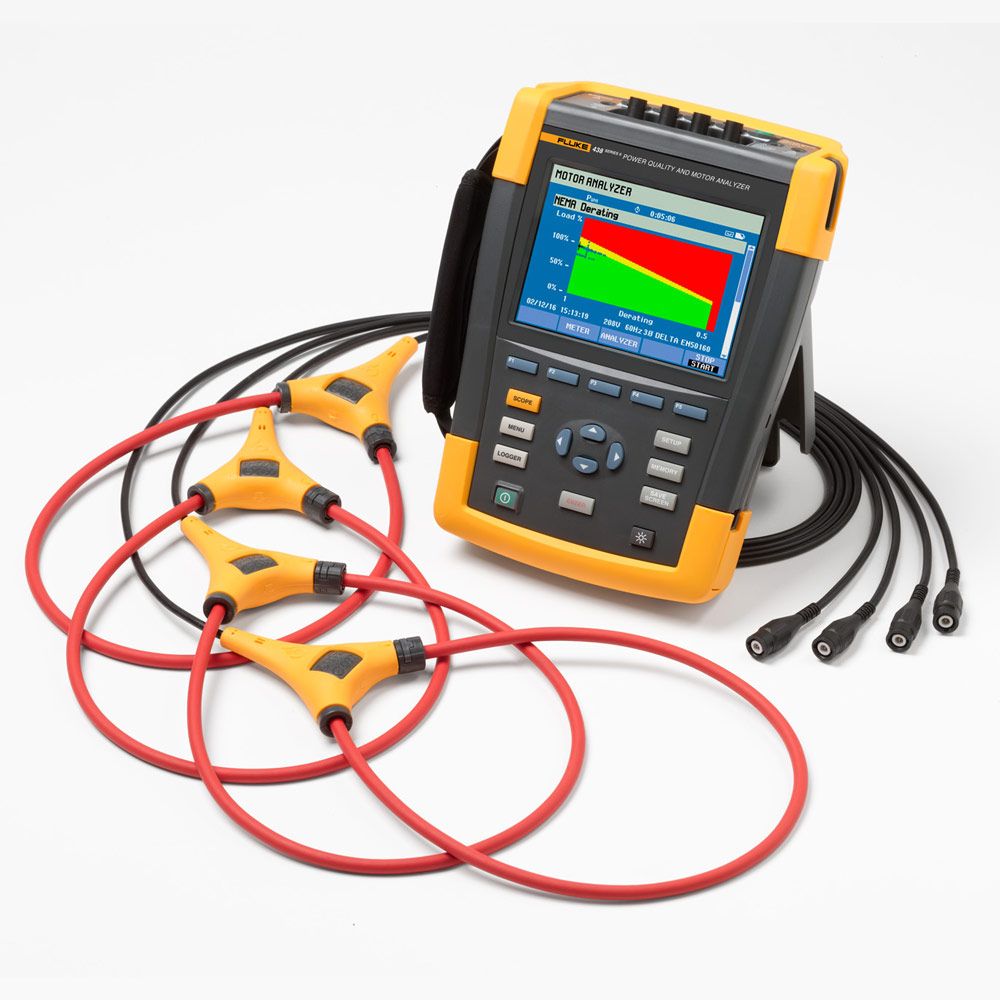
- 4 x 6,000 flexi probes
- voltage lead set
- FC WiFi SD card
- carrying case
>
Fluke 438-II mechanical metering functions
Motor torque
Calculates the amount of rotational force (displayed in lb.ft or Nm) developed by a motor and transmitted to a driven mechanical load. The motor torque is the single most critical variable that characterizes the instantaneous mechanical performance of rotating equipment driven by electric motors.
Motor speed
Provides the instantaneous motor shaft rotational speed. Combined with the motor torque, motor speed provides a snapshot of the mechanical performance of rotating equipment driven by electric motors.
Motor mechanical load
Measures the actual mechanical power (displayed in hp or kW) produced by motors and provides a direct link to overloading conditions without simply basing it on the motor current.
Motor efficiency
Shows the effectiveness of each motor within a machine, assembly line, plant, and/or facility in converting electric power to useful mechanical work. By properly aggregating the efficiencies of a population of motors the total (aggregate) efficiency can be estimated. Comparisons to expected motor efficiencies at observed operating conditions can help quantify the cost associated with motor energy inefficiency.
How it works
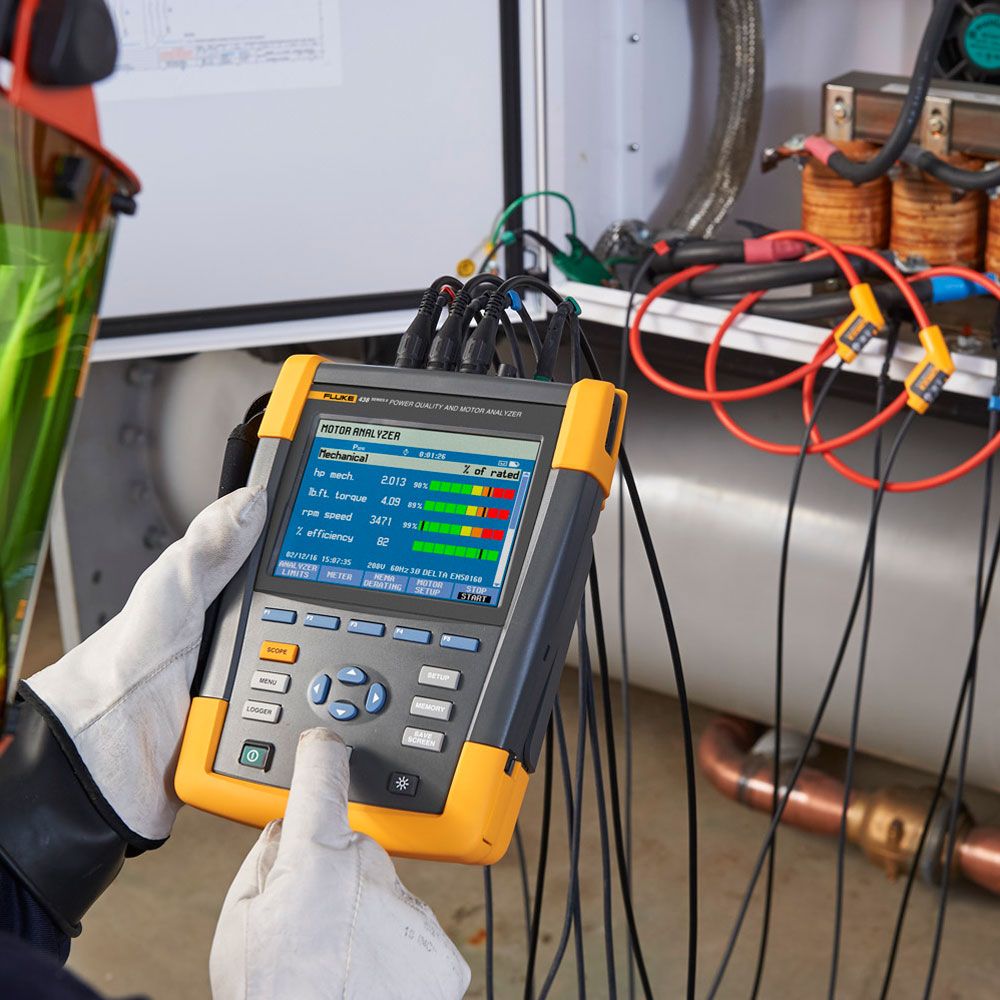
Using proprietary algorithms, the Fluke 438-II Power Quality and Motor Analyzer uses threephase current and voltage waveforms to calculate motor torque, speed, load and efficiency at a 1 second update rate. The motor air gap field, as observed via the voltage/current waveforms, provides the basis for the measurements. Mechanical sensors and intrusive no-load motor testing is not required, making it faster than ever to analyze overall electric motor performance.
Electrical motor analysis
The Fluke 438-II provides a complete breakdown of electrical parameters. Prior to beginning motor analysis, its recommended to make base line power quality measurements to assess the state of harmonics and unbalance on the electrical service output as these two properties can have a serious negative impact, on motor performance.
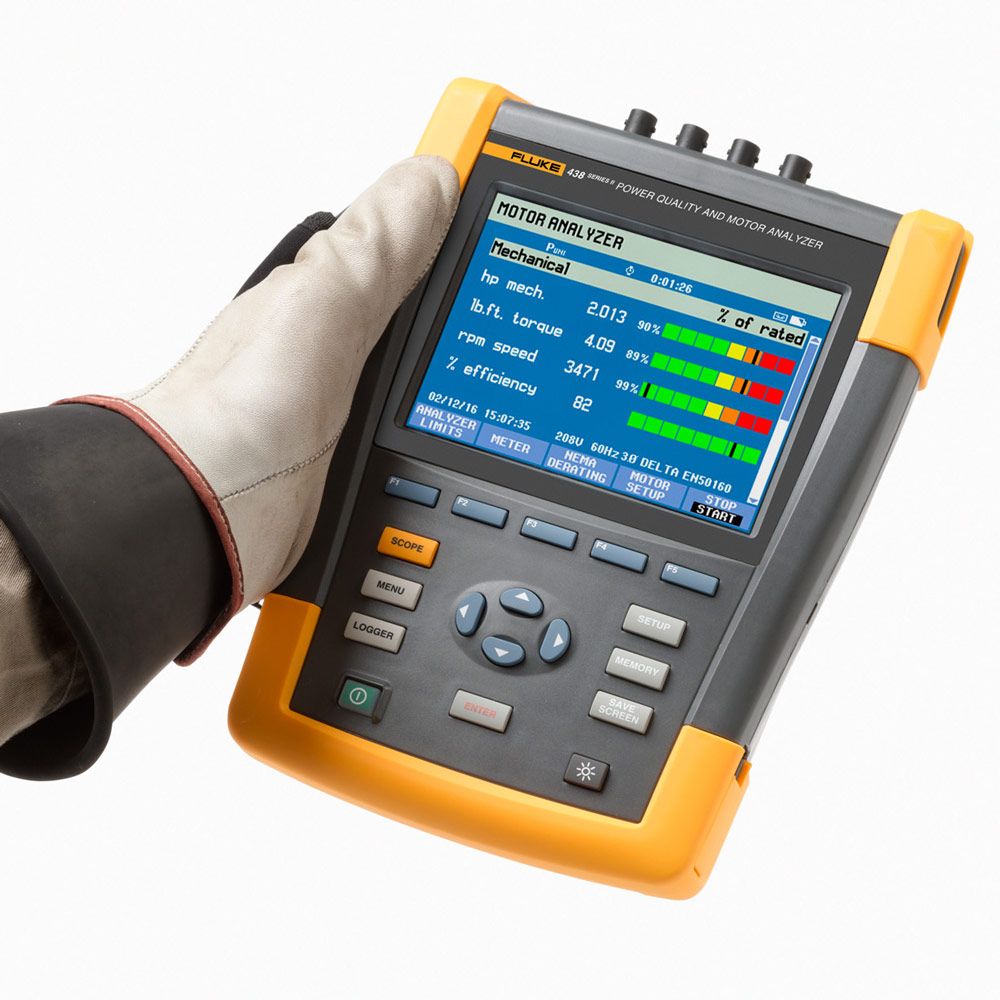
When in Motor Analysis mode, results are summarized for electrical performance, mechanical performance and derating (according to NEMA recommendations).
The easy to understand four-level color severity scale indicates motor performance in relation to the recommended electrical parameter levels including rated power, power factor, unbalance and harmonics.
For mechanical power you can instantly view the mechanical output power along with motor torque and speed. The mechanical output power is instantly compared with electrical power to provide you with live efficiency measurements. With this feature you can easily measure machine performance during each operation cycle.
The NEMA derating screen is updated as the load and the electrical conditions change, and each new measurement is plotted on the tolerance graph as a . In this example we can see that motor is within tolerance but is close to the service factor. This indicates that there may be a need for power quality mitigation, motor maintenance or some other performance improving adjustment. By frequently performing these tests over time, known benchmarks and performance trends can be created, enabling informed maintenance investment decisions.
Additional information
| Brand | Fluke |
|---|


Reviews
There are no reviews yet.